Livebook.dev The Livebook Blog logo

The Livebook Blog

Back to Homepage Subscribe to Updates

Labels

  • All Posts
  • releases
  • features
  • tutorials
  • announcements

Jump to Month

  • February 2023
  • January 2023
  • December 2022
  • October 2022
  • September 2022
  • August 2022
  • July 2022
  • May 2022
  • January 2022
  • April 2021
Powered️ byAnnounceKit

Create yours, for free!

announcements
a month ago

Livebook inside Hugging Face Spaces

We are thrilled to introduce Livebook on Hugging Face Spaces! 🎉

Each Hugging Face Space environment offers up to 16GB of RAM and 2 CPU cores for free.

If you’re unfamiliar with Hugging Face (HF), it’s a platform for building, sharing, and collaborating on machine learning applications.

This is our second integration with Hugging Face; the first was through Bumblebee, which brings pre-trained neural network models from Hugging Face to the Elixir community.

We’ve been collaborating with HF to make using Livebook on Spaces a breeze. If you have a Hugging Face account, simply click the one-click deployment button below:

Alternatively, follow the step-by-step tutorial to install Livebook in a Hugging Face Space.

Livebook with GPU acceleration on Hugging Face Spaces

One of the great features of HF Spaces is its ease of upgrading to hardware with GPU accelerators. This is particularly useful for Machine Learning applications, which can be highly parallelized and computationally intensive.

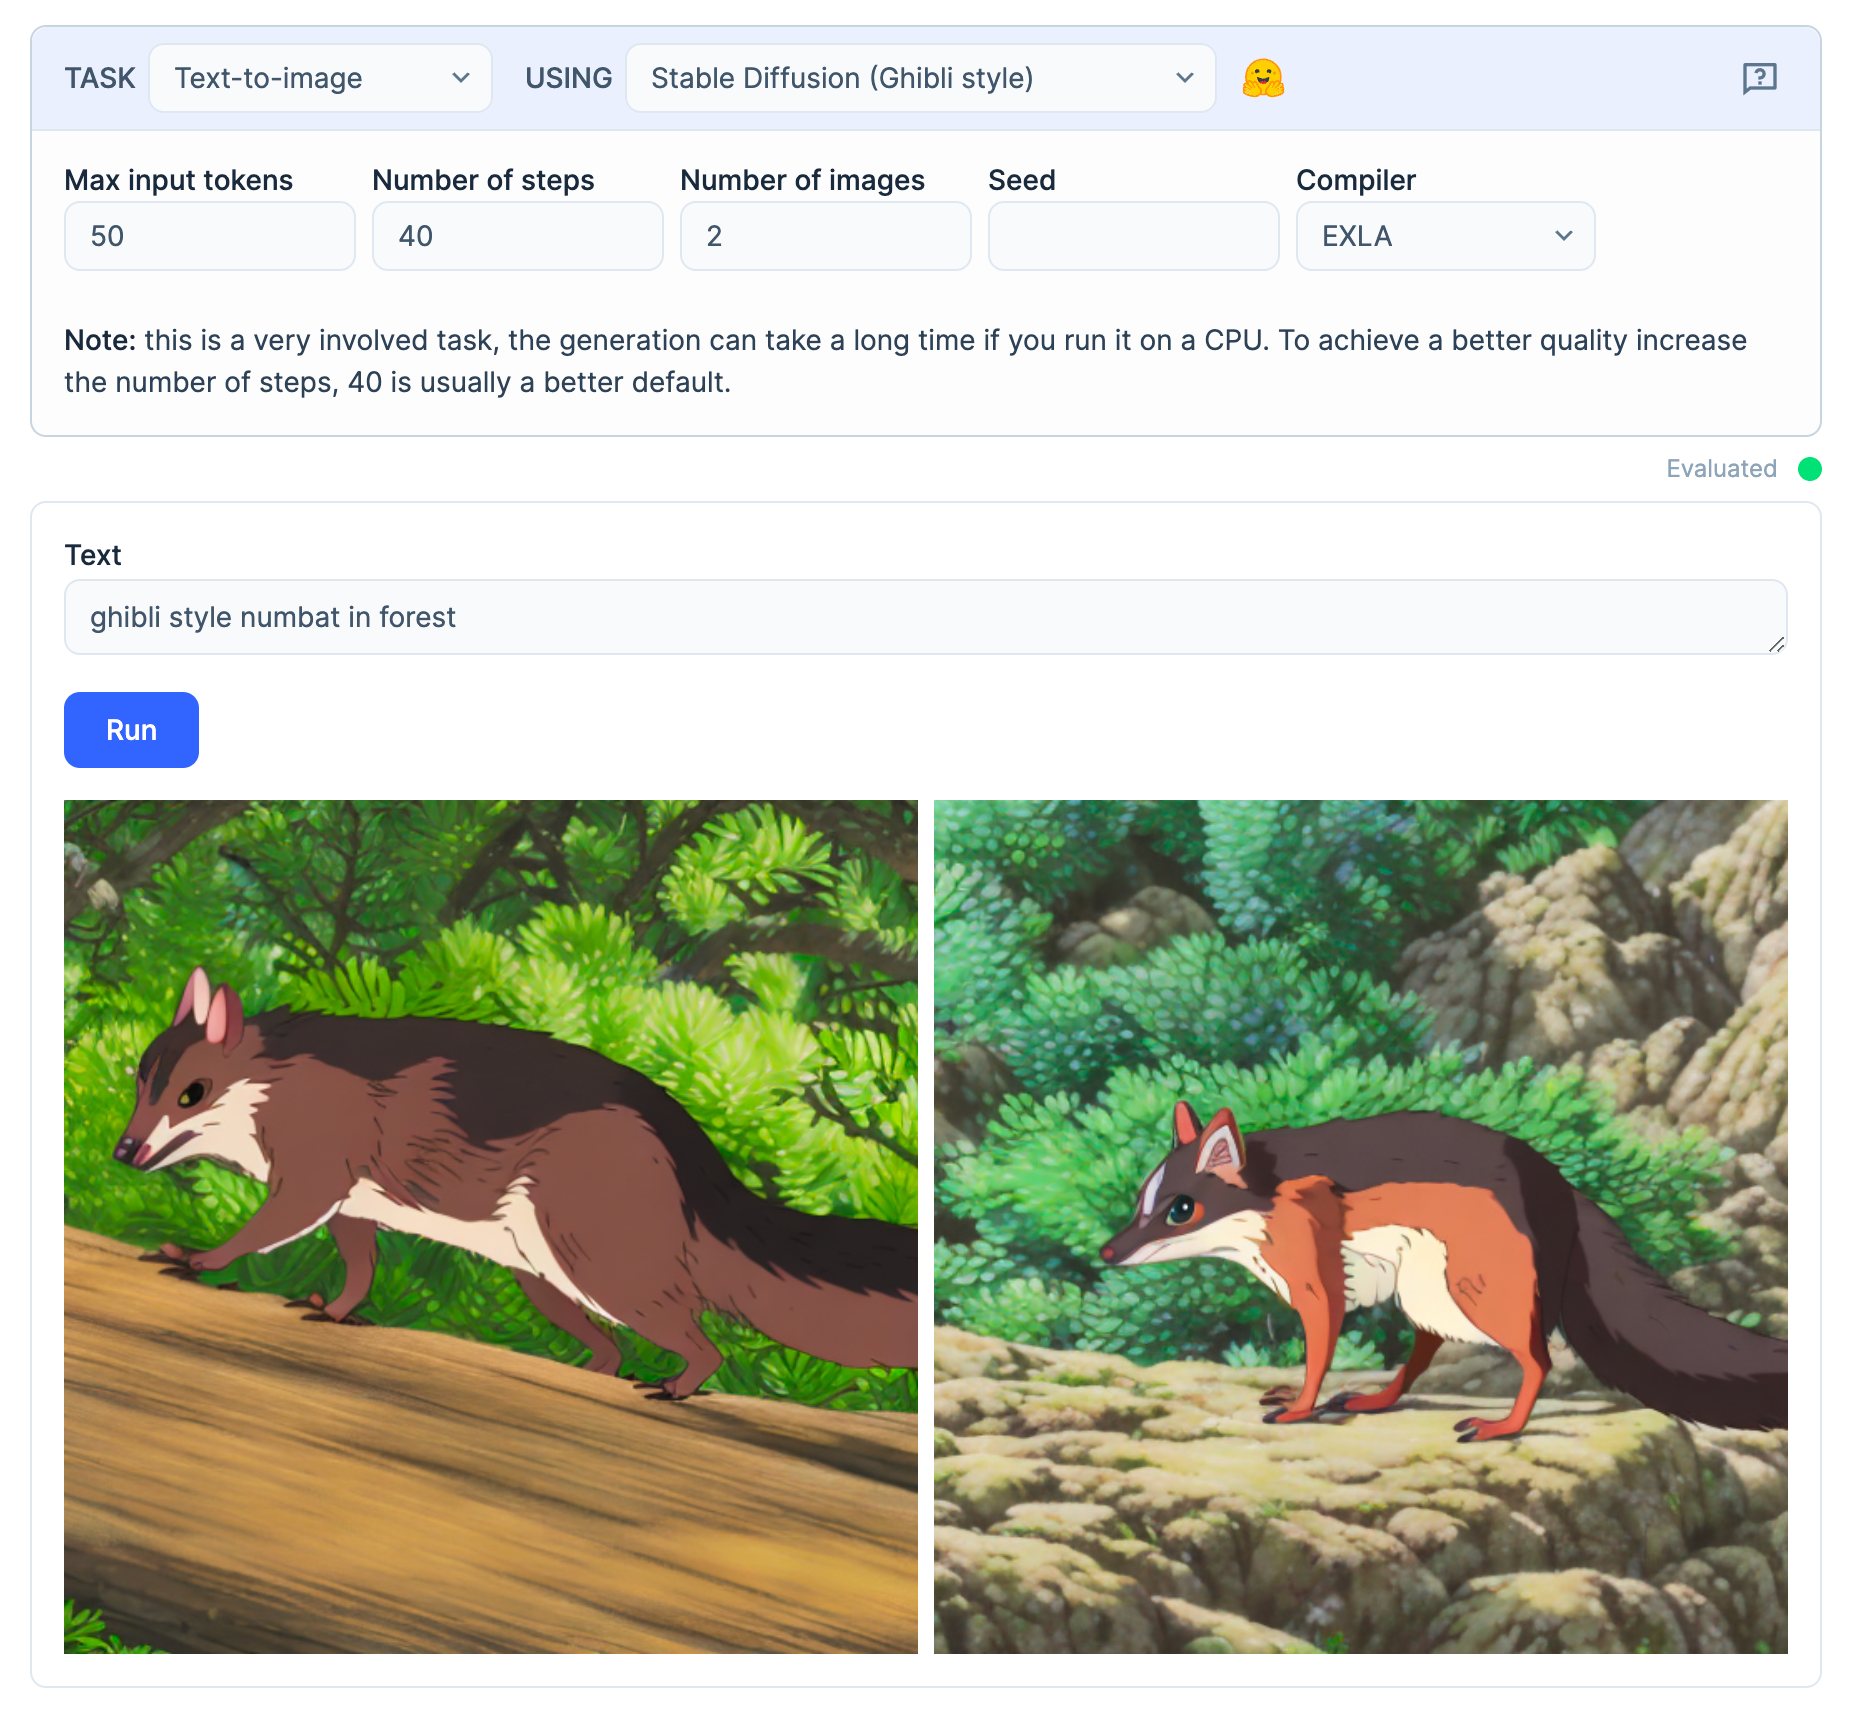
Check out this video to see how easy it is to run Stable Diffusion with Livebook on top of a Hugging Face Space powered by a GPU:

Ready to give it a try for yourself? Start experimenting with Livebook on Hugging Face Spaces now.

releases
a month ago

What’s new in Livebook 0.8.1

In this blog post, we'll take a look at some of the new features released with Livebook 0.8.1. Let's dive in!

The new file input

One of the goals of Livebook is to enable you to build interactive notebooks. That means offering various input elements that allow users to input data into the notebook.

This new version comes with two new inputs, one of them is the file input. You can use it to allow the user of your notebook to upload a file that the notebook will process.

There are many scenarios where this can be useful, for example, data exploration. Let's see how the new input can be used to explore data in a CSV file.


The new audio input

Another new input available in this release is the audio input.

It provides two options for uploading audio data: recording using a microphone or uploading an audio file.

Let's see an example of this new input in action.


Support for capturing images from the camera in the image input

The image input was first introduced in Livebook 0.8.0. With this new release, it has been improved to include the ability to take a picture using the computer's camera, in addition to uploading an image file.

Let's see how it works.

This feature was contributed by Cocoa Xu. 

Option to run the Setup cell without cache

A new option has been added to run the setup cell without cache. This can be useful when you want to force the dependencies of your notebook to be installed again from scratch.

While this was previously possible through the :force option of Mix.install/2:

Mix.install(
    [
        {:kino, "~> 0.8.1"}
    ],
    force: true
)

With this new release, it's now as simple as clicking a button:


Loading LB_ environment variables as Livebook secrets

Secrets management is a feature that was added in Livebook 0.7. It allows you to securely handle sensitive data, such as passwords and API keys.

Before this release, the UI was the only way to add secrets to Livebook. But now, there's another way.

You can provision Livebook Secrets through environment variables on the machine running your Livebook instance. Just create environment variables starting with LB_, such as LB_API_KEY or LB_DATABASE_PASSWORD, and Livebook will load them as Secrets.

This can be especially useful when running Livebook on platforms like Fly.io and Hugging Face. This means you can set up secrets on their panels, and they will directly appear in Livebook.

Let's see how that works for running Livebook via Docker.


Docker images with CUDA libraries

Last but not least, we also started to distribute Livebook via Docker images with CUDA libraries installed.

CUDA is a parallel computing platform and API that allows software to take advantage of the power of GPUs. This is particularly useful in technical fields where parallel programming can be applied, such as Machine Learning (ML).

Now running Stable Diffusion on your GPU directly from Livebook is even easier!

Try it!

To play with the new features, all you need to do is:

  • Install the new Livebook version
  • Import the notebook containing a demo of the new features by clicking on the badge below

Run in Livebook

Happy hacking!

releases
2 months ago

What's new in Livebook 0.8

Livebook 0.8 was launched a few weeks ago, and the highlight of that release was the new Neural Network Smart cell. But there are many other exciting updates included as well.

In this blog post, we will showcase ten of the most noteworthy features released with Livebook 0.8.

New mechanism for tracking how cells depend on each other

A known pain point of computational notebooks is reproducibility. But Livebook already solved that by enabling truly reproducible workflows. This was accomplished by the fact that the Livebook execution model is fully sequential, and there is no global mutable state.

Still, there was a downside with that fully sequential model. Whenever a cell was evaluated, all subsequent cells were marked as stale and required reevaluation. That happened regardless of whether those cells depended on the evaluated cell.

Not anymore!

This new release now tracks how cells depend on each other and only marks subsequent cells as stale if necessary. Let's see how that works.

Let's say you have four code cells like that:

Look how cell 4 depends on cell 1 and cell 2, but doesn't depend on cell 3. And notice how cell 4 simulates a computation that takes some time to finish.

Before Livebook 0.8, if you changed cell 3, cell 4 would become stale, even though cell 4 didn't depend on cell 3. And you'd need to reevaluate it:

With Livebook 0.8, when you change cell 3, Livebook knows that although cell 4 is subsequent to cell 3, it doesn't depend on it, so it doesn't mark cell 4 as stale anymore:

No more need to waste time waiting for unnecessary cell reevaluation!

Automatic execution of doctests

One cool feature of Elixir is Doctests. It helps you ensure that your documentation is up to date with your code.

This new release integrates Doctests natively into Livebook.

Now, whenever you evaluate a cell that contains a module definition with doctests, Livebook will automatically run those doctests for you and will show you the output:

We're planning to streamline that workflow even more in future releases.

Render math in on-hover documentation

Elixir has an amazing developer experience when it comes to documentation. And Livebook aims to leverage that.

Before this new release, Livebook already supported seeing the documentation of a module or function when you hover over it:

Now, the on-hover documentation also supports those fancy math documentation of yours (based on KaTeX)

View and delete secrets in the sidebar

Livebook 0.7 introduced secret management. A solution to help you manage sensitive data used by your notebooks, like passwords and API keys.

With this new release, you can also view and delete those secrets in the notebook sidebar:

Support for image input

Livebook enables you to add a variety of user inputs to your notebooks, making them interactive and parametrizable.

This new release comes with a new input that allows the user of your notebook to upload images:

Visualization of nested data as a tree view

Inspecting a nested data structure can be hard when it gets big. For example, when you want to check the result of an HTTP API call.

With Kino 0.8 that accompanies the Livebook release, you can now visualize and inspect nested data in a tree view, so it gets easier to understand it:

This was a community contribution by Stefan Chrobot. He started the project during Spawnfest and won 2nd place overall. Shout out to him!

Neural Network Smart cell

We discussed that new feature in detail in a previous post. But it's so cool that we thought it was worth mentioning it again here.

That new Smart cell allows you to run various machine learning models directly in Livebook with just a few clicks. Here's an example of a text classification model:

Slack Message Smart cell

Let's say you want to send a notification to your Slack after your notebook completes some automation.

With the new Slack Smart cell, that's dead easy:

Geocoding in Map Smart cell

The Map Smart cell got even better. Now besides accepting data as latitude and longitude, you can also use the names of countries, states, cities, counties, and streets.

Let's see how that works:

More options to configure charts with the Chart Smart Cell

We added new options to help you customize your charts even more.

You can now toggle the bin config to discretize numeric values into a set of bins. This is useful for creating histograms, for example. Here's how it works:

Another new option is the color scheme. You can now choose your chart's color from a set of named color palettes. Here's how it works:

Last but not least, let's check the new scale config. You can use it to change the scale type of your chart, for example, from a linear to a log scale. Let's see how it works:

Try it!

To play with the new features, all you need to do is:

  • Install the new Livebook version
  • Import a notebook containing a demo of the new features by clicking on the badge below

Run in Livebook

Happy hacking!

announcements
3 months ago

Announcing Bumblebee: GPT2, Stable Diffusion, and more in Elixir

We are glad to announce a variety of Neural Networks models are now available to the Elixir community via the Bumblebee project.

We have implemented several models, from GPT2 to Stable Diffusion, in pure Elixir, and you can download training parameters for said models directly from Hugging Face.

To run your first Machine Learning model in Elixir, all you need is three clicks, thanks to our integration between Livebook and Bumblebee. You can also easily embed and run said models within existing Elixir projects.

Watch the video by José Valim covering all of these topics and features:

Running Machine Learning models with Livebook

Here are some examples of what it looks like to use Livebook to run Machine Learning models:

Text to image

Image classification

Text classification

Text generation

Incorporating models into any Elixir project

Thanks to the new Nx.Serving functionality, you should be able to incorporate those models into any existing project with little effort and run them at scale.

You should be able to embed and serve these models as part of your existing Phoenix web applications, integrate them into data processing pipelines with Broadway, and deploy them alongside Nerves embedded systems - without needing 3rd-party dependencies.

Here’s an example of using Bumblebee to run an image classification model inside a Phoenix app:

Integration with Hugging Face

Bumblebee allows you to download and use trained models directly from Hugging Face. Let’s see an example of how we can generate text continuation using the popular GPT-2 model:

{:ok, gpt2} = Bumblebee.load_model({:hf, "gpt2"})
{:ok, tokenizer} = Bumblebee.load_tokenizer({:hf, "gpt2"})

serving = Bumblebee.Text.generation(gpt2, tokenizer, max_new_tokens: 10)

text = "Yesterday, I was reading a book and"
Nx.Serving.run(serving, text)

#=> %{
#=>    results: [
#=>        %{
#=>            text: "Yesterday I was reading a book and I was thinking, 'What's going on?'"
#=>        }
#=>    ]
#=> }

As you can see, we just load the model data and use a high-level function designed for the text generation task, that’s it!

Compiling to CPU/GPU

All of our Neural Networks can be compiled to the CPU/GPU, thanks to projects such as EXLA (based on Google XLA) and Torchx (based on Libtorch).

A massive milestone in our Numerical Elixir effort

This release is a huge milestone in our Numerical Elixir effort, which started almost two years ago. These new features, in particular, are possible thanks to the enormous efforts of José Valim, Jonatan Kłosko, Sean Moriarity, and Paulo Valente. We are also thankful to Hugging Face for enabling collaborative Machine Learning across communities and tools, which played an essential role in bringing the Elixir ecosystem up to speed.

Next, we plan to focus on training and transfer learning of Neural Networks in Elixir, allowing developers to augment and specialize pre-trained models according to the needs of their businesses and applications. We also hope to publish more on our progress in developing traditional Machine Learning algorithms.

Your turn

If you want to give Bumblebee a try, you can:

  • Download Livebook v0.8 and automatically generate “Neural Networks tasks” from the “+ Smart” cell menu inside your notebooks.
  • We have also written single-file Phoenix applications as examples of Bumblebee models inside Phoenix (+ LiveView) apps. Those should provide the necessary building blocks to integrate Bumblebee into your production app.
  • For a more hands-on approach, read some of our notebooks.

If you want to help us build the Machine Learning ecosystem for Elixir, check out the projects above, and give them a try. There are many exciting areas, from compiler development to model building. For instance, pull requests that bring more models and architectures to Bumblebee are welcome. The future is concurrent, distributed, and fun!

releases
5 months ago

What's new in Livebook 0.7

Livebook v0.7 is out! This is a major release coming with significant features in the following areas:

  • secret management
  • visual representations of the running system (supervision trees, inter-process messaging, and more)
  • an interactive user interface to visualize and edit Elixir pipelines

Let’s take a look at each of those.

We also created a video showing each one of those features:

Secret management

We know that putting sensitive data in your code, like passwords and API keys, is a security risk. With this new v0.7 release, Livebook has an integrated way to help you deal with that. We’re calling it Secrets. Let’s see an example.

Let’s say you’re writing a notebook that consumes data from an API that requires authentication:

api_username = "postman"
api_password = "password"

Req.get!("https://postman-echo.com/basic-auth", auth: {api_username, api_password})

This piece of code is hardcoding API username and password, but you want to avoid that. You can do that by creating two Livebook secrets, one for the API username and one for the API password:

Now, you can refactor your code to get the username and password values from those secrets by using System.fetch_env!/1:

api_username = System.fetch_env!("LB_API_USERNAME")
api_password = System.fetch_env!("LB_API_PASSWORD")

Req.get!("https://postman-echo.com/basic-auth", auth: {api_username, api_password})

Notice that Livebook adds an LB_ namespace to the environment variable name.

Let’s say you share with a co-worker that notebook that is using Livebook Secrets. If that person doesn’t have those secrets configured in their Livebook instance yet, when they run the notebook, Livebook will automatically ask them to create the required secrets! No more hidden secrets (pun intended 🤭). Here’s what it looks like:

The new Secrets feature is also already integrated with Database Connection Smart cells. When you’re creating a connection to PostgreSQL or Amazon Athena, Livebook will give you the option to use a Secret for the database password:


With Livebook Enterprise, you will be able to share secrets within your team and company. This allows notebooks to be safely versioned and distributed, even if they contain credentials or other restricted information.

Visual representations of the running system

One interesting aspect of coding is that it can feel like we’re “building castles in the air.” We can build something with our thoughts materialized by code, which is amazing!

But, because of the intangible nature of code, sometimes it can be hard to reason about it. When reading a piece of code, you’re simultaneously building a representation of how it works inside your mind. What if you could get some help with visualizing that?

That’s when the idea of “a picture is worth a thousand words” comes in handy.

Imagine someone who’s learning Elixir. The person is learning message passing between processes, and they are analyzing the following example:

parent = self()

child =
  spawn(fn ->
        receive do
            :ping -> send(parent, :pong)
        end
    end)

send(child, :ping)

receive do
    :pong -> :ponged!
end

Instead of making the person create a representation of how that code works only through text, we could show them a visual representation of it.

Since v0.5, Livebook has a way to show visual widgets to the user, through its Kino package. And with this v0.7 release, we have a new Kino widget to show a visual representation of message passing between Elixir processes.

All you need to do is wrap your code with Kino.Process.render_seq_trace/2:

Seeing a visual representation of code is not only applicable when you’re just getting started with Elixir. Imagine, for example, you need to code something that performs a job concurrently, and you discover Elixir’s Task.async_stream/3. You read its documentation and understand its API, but you also want to learn more about how it orchestrates multiple processes. You could use Livebook to visualize that:

Besides visualizing message passing, you can now use Livebook to visualize a supervision tree. You can do that by calling the Kino.Process.render_sup_tree/2 function with the supervisor’s PID:

Livebook will also automatically show you a supervision tree if your cell returns the PID of a supervisor:

This feature has been contributed by Alex Koutmos, and it is a great example of how modern notebooks can benefit from an open-source community.

Interactive user interface to visualize and edit Elixir pipelines

Elixir 1.14 came with a fantastic new feature for debugging called dbg. It can do many things, one of which is to help inspect a pipeline. So we thought, “how would dbg work inside Livebook?”

Maybe we could do some visualization of the pipeline, showing the result of each pipeline step, as the regular dbg does. But, since we’re already in a more visual environment, we went one step further. We built not only a visualization of an Elixir pipeline but also the ability to edit and interact with it!

Let’s say you run the following pipeline inside Livebook:

"Elixir is cool!"
|> String.trim_trailing("!")
|> String.split()
|> List.first()
|> dbg()

When you do that, Livebook will show a widget that you can use to:

  • see the result of the pipeline
  • enable/disable a pipeline step
  • drag and drop a pipeline step to re-order the pipeline

Here’s what it looks like:

This can be very helpful if you’re trying to understand what each step of a pipeline is doing. Ryo Wakabayashi created a cool example showing how that could be applied to a pipeline that is using Elixir to process an image using Evision:

image_path
|> OpenCV.imread!()
|> OpenCV.blur!([9, 9])
|> OpenCV.warpAffine!(move, [512, 512])
|> OpenCV.warpAffine!(rotation, [512, 512])
|> OpenCV.rectangle!([50, 10], [125, 60], [255, 0, 0])
|> OpenCV.ellipse!([300, 300], [100, 200], 30, 0, 360, [255, 255, 0], thickness: 3)
|> Helper.show_image()
|> dbg()


Other notable features and improvements

Besides those three big features, this new version contains many other news. You can check our GitHub repo’s changelogs to see everything that comes with this new version.

  • Livebook’s changelog
  • Kino’s changelog
  • KinoDB’s changelog

Organize your cell output with a tab or grid layout

You can now use Kino.Layout.tabs/1 to show the output of your cell in tabs. Here’s an example of how to do it:

data = [
    %{id: 1, name: "Elixir", website: "https://elixir-lang.org"},
    %{id: 2, name: "Erlang", website: "https://www.erlang.org"}
]

Kino.Layout.tabs(
    Table: Kino.DataTable.new(data),
    Raw: data
)

Here’s what it looks like:

You can also use Kino.Layout.grid/2 to show the output of your cell in a grid. Here’s an example of how to do it:

urls = [
  "https://images.unsplash.com/photo-1603203040743-24aced6793b4?ixlib=rb-1.2.1&ixid=MnwxMjA3fDB8MHxwaG90by1wYWdlfHx8fGVufDB8fHx8&auto=format&fit=crop&w=580&h=580&q=80",
  "https://images.unsplash.com/photo-1578339850459-76b0ac239aa2?ixlib=rb-1.2.1&ixid=MnwxMjA3fDB8MHxwaG90by1wYWdlfHx8fGVufDB8fHx8&auto=format&fit=crop&w=580&h=580&q=80",
  "https://images.unsplash.com/photo-1633479397973-4e69efa75df2?ixlib=rb-1.2.1&ixid=MnwxMjA3fDB8MHxwaG90by1wYWdlfHx8fGVufDB8fHx8&auto=format&fit=crop&w=580&h=580&q=80",
  "https://images.unsplash.com/photo-1597838816882-4435b1977fbe?ixlib=rb-1.2.1&ixid=MnwxMjA3fDB8MHxwaG90by1wYWdlfHx8fGVufDB8fHx8&auto=format&fit=crop&w=580&h=580&q=80",
  "https://images.unsplash.com/photo-1629778712393-4f316eee143e?ixlib=rb-1.2.1&ixid=MnwxMjA3fDB8MHxwaG90by1wYWdlfHx8fGVufDB8fHx8&auto=format&fit=crop&w=580&h=580&q=80",
  "https://images.unsplash.com/photo-1638667168629-58c2516fbd22?ixlib=rb-1.2.1&ixid=MnwxMjA3fDB8MHxwaG90by1wYWdlfHx8fGVufDB8fHx8&auto=format&fit=crop&w=580&h=580&q=80"
]

images =
    for {url, i} <- Enum.with_index(urls, 1) do
        image = Kino.Markdown.new("![](#{url})")
    label =  Kino.Markdown.new("**Image #{i}**")
        Kino.Layout.grid([image, label], boxed: true)
    end

Kino.Layout.grid(images, columns: 3)

Here’s what it looks like:

Universal desktop build for Mac and automated nightly builds

We made some improvements in the build process of Livebook Desktop.

First, we unified the Mac Intel and Mac Silicon download files into a single Mac Universal file. No need to ask yourself if you’re supposed to download the Intel or Silicon distribution. Pretty neat!

Second, we automated the build process of generating Livebok Desktop. We’re using that to do nightly builds of Livebook Desktop based on the main branch of our GitHub repo.

That means now you can use our nightly builds to download Livebook Desktop and play with the new features we’re still working on before we launch a new release. 😉

Try it!

To play with the new features all you need to do is:

  1. Install the new Livebook version
  2. Import this notebook containing a demo of the new features

Run in Livebook

Our team put a lot of effort into this new release, and we’re very excited about it! We hope you like it too.

Happy hacking!

tutorials
5 months ago

How to query and visualize data from Amazon Athena using Livebook

Livebook has built-in integrations with many data sources, including Amazon Athena.

In this blog post, you'll learn how to use Livebook to connect to Amazon Athena, execute a SQL query against it, and visualize the data.

You can also run this tutorial inside your Livebook instance by clicking the button below:

Run in Livebook

Connecting to Amazon Athena using the Database connection Smart cell

To connect to Amazon Athena, you'll need the following info from your AWS account:

  • AWS access key ID
  • AWS secret access key
  • Athena database name
  • S3 bucket to write query results to

Now, let's create an Amazon Athena connection using a Database connection Smart cell. Click the options "Smart > Database connection > Amazon Athena":

Once you've done that, you'll see a Smart cell with input fields to configure your Amazon Athena connection:

Fill in the following fields to configure your connection:

  • Add your AWS access key ID
  • Add your AWS secret access key
  • Add your Athena database name
  • Add your S3 bucket in the "Output Location" field

Now, click the "Evaluate" icon to run that Smart cell. Once you've done that, the Smart cell will configure the connection and assign it to a variable called conn.

Querying Amazon Athena using the SQL Query Smart cell

Before querying Athena, we need to have an Athena table to query from. So, let's create one.

We'll create an Athena table based on a public dataset published on AWS Open Data. We'll use the GHCN-Daily dataset, which contains climate records measured by thousands of climate stations worldwide. Let's create an Athena table called stations with metadata about those climate stations.

To do that, Add a new SQL Query Smart cell by clicking the options "Smart > SQL Query":

Copy and paste the SQL code below to the SQL Query cell:

CREATE EXTERNAL TABLE IF NOT EXISTS default.stations (
  station_id string, 
  latitude double, 
  longitude double, 
  elevation double, 
  name string)
ROW FORMAT SERDE 
  'org.apache.hadoop.hive.serde2.RegexSerDe' 
WITH SERDEPROPERTIES ( 
  'input.regex'='([^ ]*) *([^ ]*) *([^ ]*) *([^ ]*) *(.+)$') 
STORED AS INPUTFORMAT 
  'org.apache.hadoop.mapred.TextInputFormat' 
OUTPUTFORMAT 
  'org.apache.hadoop.hive.ql.io.HiveIgnoreKeyTextOutputFormat'
LOCATION
  's3://livebook-blog/amazon-athena-integration'
TBLPROPERTIES (
  'typeOfData'='file')

Now, click the "Evaluate" icon to run that Smart cell. Now we have an Athena table to query from.

Add a new SQL Query Smart cell and copy and paste the following SQL query to it:

select * from default.stations order by station_id

Evaluate that cell. It will query your Athena table and assign the results to a result2 variable. You'll see the result of that query in a tabular format like this:

Visualizing geographic coordinates data using the Map Smart cell

Notice that the table we created has each climate station's latitude and longitude information. We can visualize that data with a map visualization using the Map Smart cell. Let's do that.

Add a Map Smart cell by clicking the options "Smart > Map":


Your Map Smart cell will look something like this:

Use your Map Smart cell to configure:

  • the layer name
  • the data source
  • the coordinates format
  • the longitude field
  • the latitude field

Once you've configured the Smart cell, you can evaluate it, and it will build a map for you. It will look something like this:

That's it! Using Livebook Smart cells, you can connect to an Amazon Athena database, execute a SQL query against it and visualize the result.


6 months ago

Livebook + SpawnFest = ❤️ & 💻

Good news, SpawnFest will have a specific category for Livebook-based projects this year!

SpawnFest is an annual 48-hour online software development contest in which teams from around the world get exactly one weekend to create the best BEAM-based applications they can.

Over the years, we've seen many fantastic projects coming out of SpawnFest. We're excited to partner with them this year to bring that energy to the Livebook community. We're sponsoring a category for Livebook-based projects. The idea is to incentivize the community to develop more ideas on how to use Livebook while also supporting a community event.

There are two kinds of projects you'll be able to build:

  • a Livebook notebook
  • a Livebook Smart Cell

You could build all sorts of cool stuff using a Livebook notebook. Here are a few ideas for what to build with a Livebook notebook:

  • integrating and playing with APIs
  • data exploration and visualization
  • machine learning models
  • interactive data apps

With Smart Cells, you can build a custom notebook cell that could be reused by your notebooks or other community members.

If you want to see some examples of custom Smart Cells, here's a Smart Cell that allows querying the GitHub GraphQL API. And here's another one that allows connecting to a remote node in an Elixir cluster and optionally send a :erpc call.

And if you'd like a few ideas of what to build using a Smart Cell, here are a few:

  • a Smart Cell that sends a message to Slack
  • a Smart Cell where you could fill in some input fields, and then it sends an HTTP request to some API
  • a Smart Cell that builds a connection to a database, service, or server

How to get started with Livebook

If you haven't used Livebook yet, it's easier than ever to get started because of our new desktop app. You can download and install it in a couple of minutes.

Once you have installed it, you can use the built-in notebooks to learn how to use Livebook. You can do that by opening Livebook and going to Explore section:

Livebook Explore section

In the Explore section, you'll find many notebooks that will help you to learn how to use Livebook. We currently have builtin notebooks about:

  • learning Elixir
  • how to use Livebook itself
  • how to create charts (using VegaLite)
  • how to plot maps using geospatial and tabular data (using MapLibre)
  • how to build interactive notebooks (using Kino)
  • how to build a custom Smart Cell

This year SpawnFest will be on October 15th and 16th. Visit the event's website to learn more about it and how to register.

We're looking forward to seeing what you'll build using Livebook! =D

tutorials
7 months ago

How to query and visualize data from Google BigQuery using Livebook

Querying and visualizing data from a database is a common and recurring task. That's the kind of thing you don't want to repeat yourself, writing the same code repeatedly. That's where Livebook Smart cells come in. It helps you to automate any workflow you want.

Livebook has built-in Smart cells that help you query and visualize data from multiple databases, like PostgreSQL, MySQL, Google BigQuery, AWS Athena, and SQLite.

This article explains how to use Livevook Smart cells to query and visualize data from a Google BigQuery dataset.

If you like video format, here's a video version of this article:

You can also run this tutorial inside your Livebook instance:

Run in Livebook

Connecting to Google BigQuery using the Database connection Smart cell

Before connecting to a Google BigQuery dataset, you need to create a Google Cloud service account and a service account key. Follow the steps in this guide and download the generated service account key JSON file. That file contains the info needed to configure a connection to Google BigQuery.

Now, create a new notebook. Then, let's create a Google BigQuery connection using a Database connection smart cell. Click the options "Smart > Database connection > Google BigQuery":

Once you've done that, you'll see a Smart cell with input fields to configure your Google BigQuery connection:

Configure your Google BigQuery connection by following the instructions inside the Smart cell:

  • Add your Google Cloud Project ID
  • Upload your JSON credentials file

Pro tip: if you have an authenticated gcloud CLI in the machine running your Livebook instance, then Livebook will automatically pick up your Google Cloud credentials and use it for access. No need to upload the JSON file. 😉

Now, click the "Evaluate" icon to run that Smart cell. Once you do that, the Smart cell will configure the connection and assign it to a variable called conn.

Querying Google BigQuery using the SQL Query smart cell

Now, let's use your Google BigQuery connection to query a Google BigQuery public dataset.

Add a new SQL Query smart cell by clicking the options "Smart > SQL Query":

Once done, you can write and execute a SQL query inside that cell. Let's query a public Google BigQuery dataset.

Copy the following query to the cell:

select t.year, t.country_name, t.midyear_population
from bigquery-public-data.census_bureau_international.midyear_population as t
where year < 2022
order by year

And execute the cell. The Smart cell will execute the query and assign its result to a variable called result. It also will show you the result of the query in a table format, like this:

Visualizing data from Google BigQuery using the Chart smart cell

Now we can visualize the result from that query using a Chart smart cell.

Add a new Chart smart cell by clicking the option "Smart > Chart":

Your newly created Chart smart cell will look something like this:

Now, let's use that cell to visualize the results from our query.

The query we wrote returned the population per year per country from the International Census Data, which is published as a Google BigQuery public dataset. We can use that data to visualize how the world population has been growing over the years.

Use your Chart smart cell to configure:

  • the chart's title
  • the chart's width
  • the chart's type
  • the x-axis and its type
  • the y-axis, its type, and aggregate

Once you've configured the cell, you can evaluate it, and it will build a chart for you. It will look something like this:


That's it! Using Livebook Smart cells, you can connect to a Google BigQuery dataset, execute a SQL query and visualize the results with a chart. And since this is quite a common task, Smart cells enable you to do that without writing a single line of code! 

And, if you need more customization in any part of the process, easy peasy. You can easily convert a Smart cell to a code cell and edit the code generated for you. To do that, click in a Smart cell, and then click the "Convert to Code cell" icon:

When you click the "Convert to Code cell" icon, it will transform your Smart cell into a Code cell. You'll be able to see the code that was running behind the Smart cell and edit it as you like:


features
7 months ago

Introducing the Livebook Desktop app 🎉

We want Livebook to be accessible to as many people as possible. Before this release, installing Livebook on your machine could be considered easy, especially if you already had Elixir installed.

But imagine someone who's not an Elixir developer. They had to either install Docker or Elixir before getting started with Livebook. And if they are in their first steps as developers, even using a terminal could be demanding.

That's why we built Livebook desktop. It's the simplest way to install Livebook on your machine.

Livebook desktop app

Livebook desktop doesn't require the person to have Elixir previously installed on their machine. And it works both on the Mac and Windows.

We hope that the desktop app enables way more people to try Livebook. 

For example, let's say you want to help your friend to start learning Elixir. You can tell that person to download Livebook desktop and follow the built-in "Distributed portals with Elixir" notebook, a fast-paced introduction to Elixir.

Or maybe for the data scientist that heard about Livebook and wants to try it. That person can download Livebook desktop and learn how to do data visualization in Livebook with the built-in "Plotting with VegaLite" and  "Maps with MapLibre" notebooks.

If you want to try the Livebook desktop app, it's just one click away.

We hope you enjoy it! 😊

releases
10 months ago

v0.6: Automate and learn with smart cells

Livebook v0.6 is out with a number of exciting features! Join us, as we go from a database connection to charting the data in a few simple steps:

Below is a quick overview of the biggest features in this new version.

Smart cells

Livebook v0.6 introduces a new type of cells to help you automate and master entire coding workflows! Smart cells are UI components for performing high-level tasks, such as charting your data:

We already have a couple Smart cells - including connection to PostgreSQL and MySQL - but the best part is that anyone can create new Smart cells and share with the community. We can't wait to automate workflows from HTTP requests to Machine Learning models!

Package search

The new version also brings a much more integrated dependency management, including the new package search and the setup cell:

Error highlighting

You will also find better error reporting! Spot typos and syntax errors right away with the new squiggly lines:

Streamlined diagrams

In the previous release we introduced support for Mermaid.js diagrams in Markdown cells. It's now even easier with the new Diagram button:

There's more

There are many other notable features, including "code zen" and persistent configuration. Check out the technical release notes for the complete list of changes.